
 Find-R-Scopes

 Filters
 Lenses
 Cameras
 Lighting
 Accessories



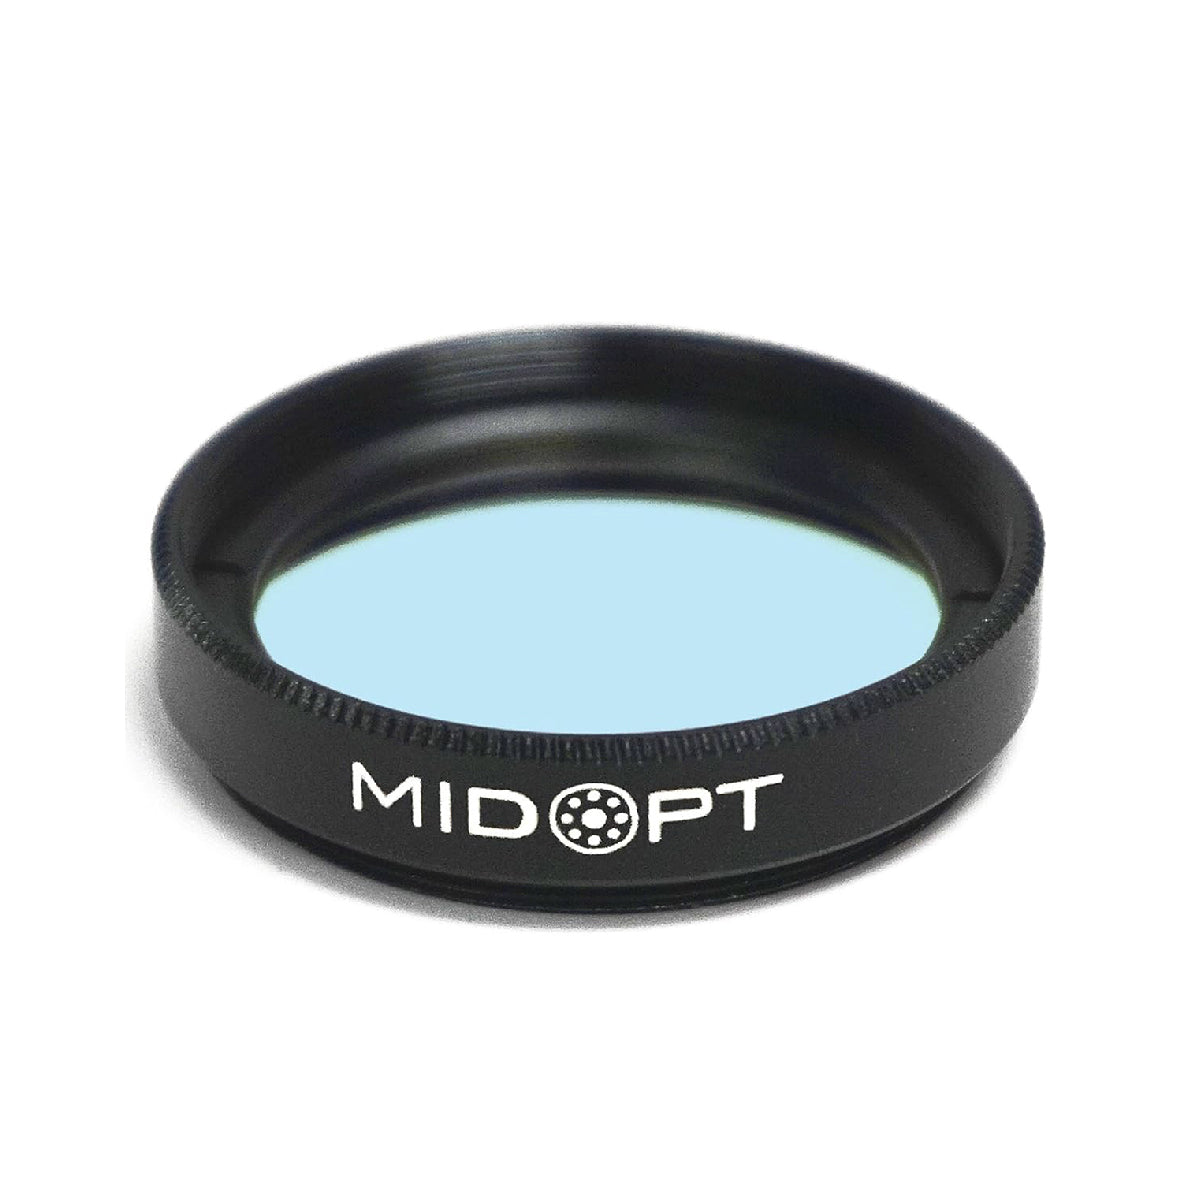
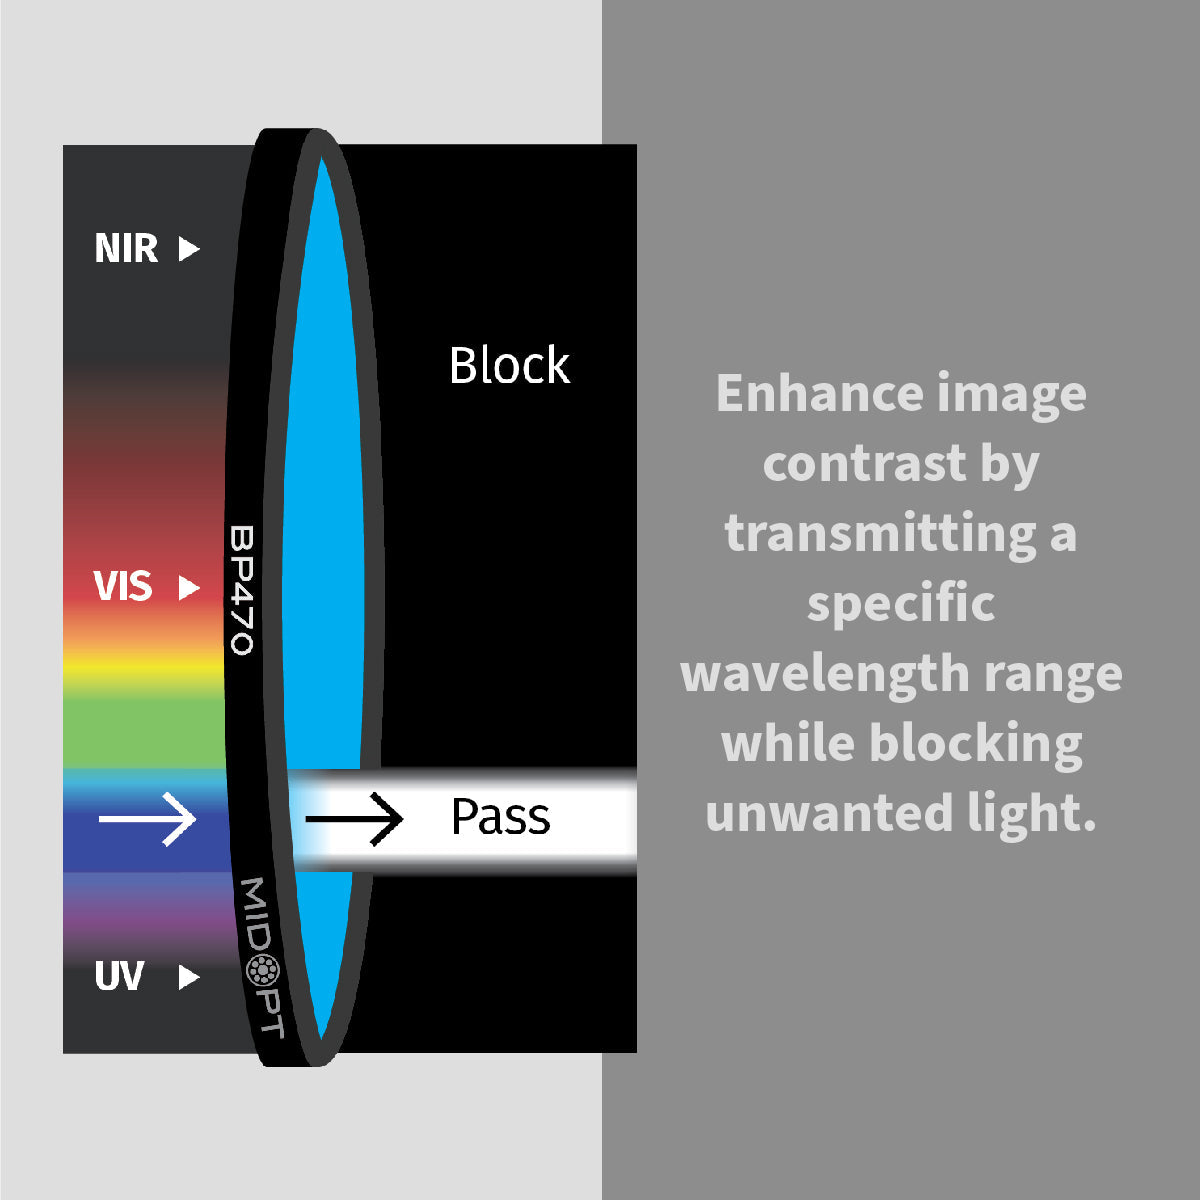
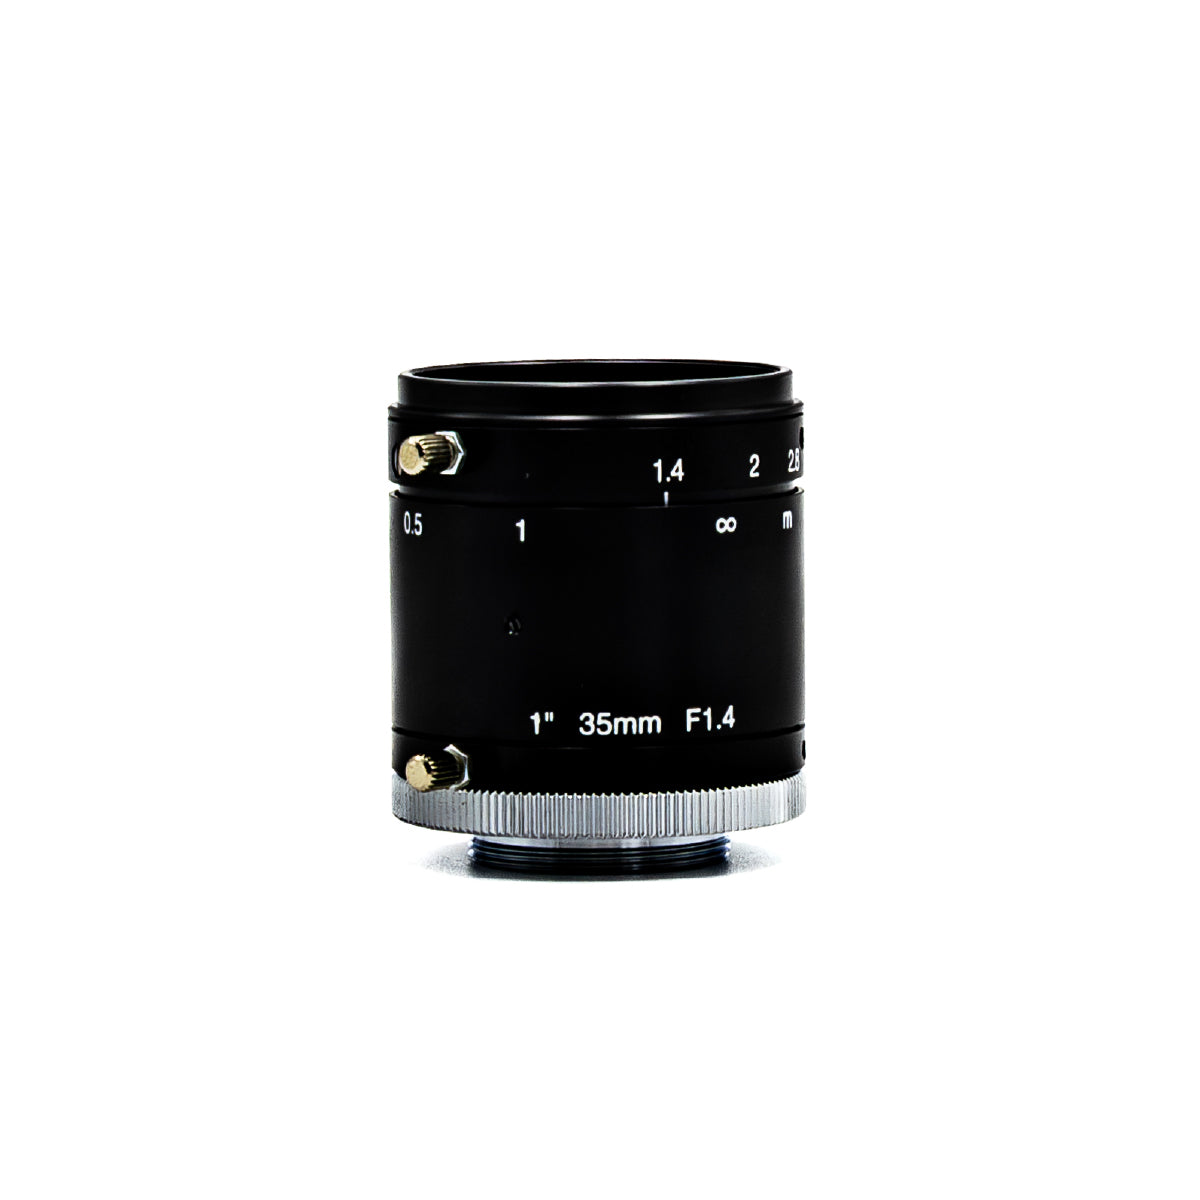
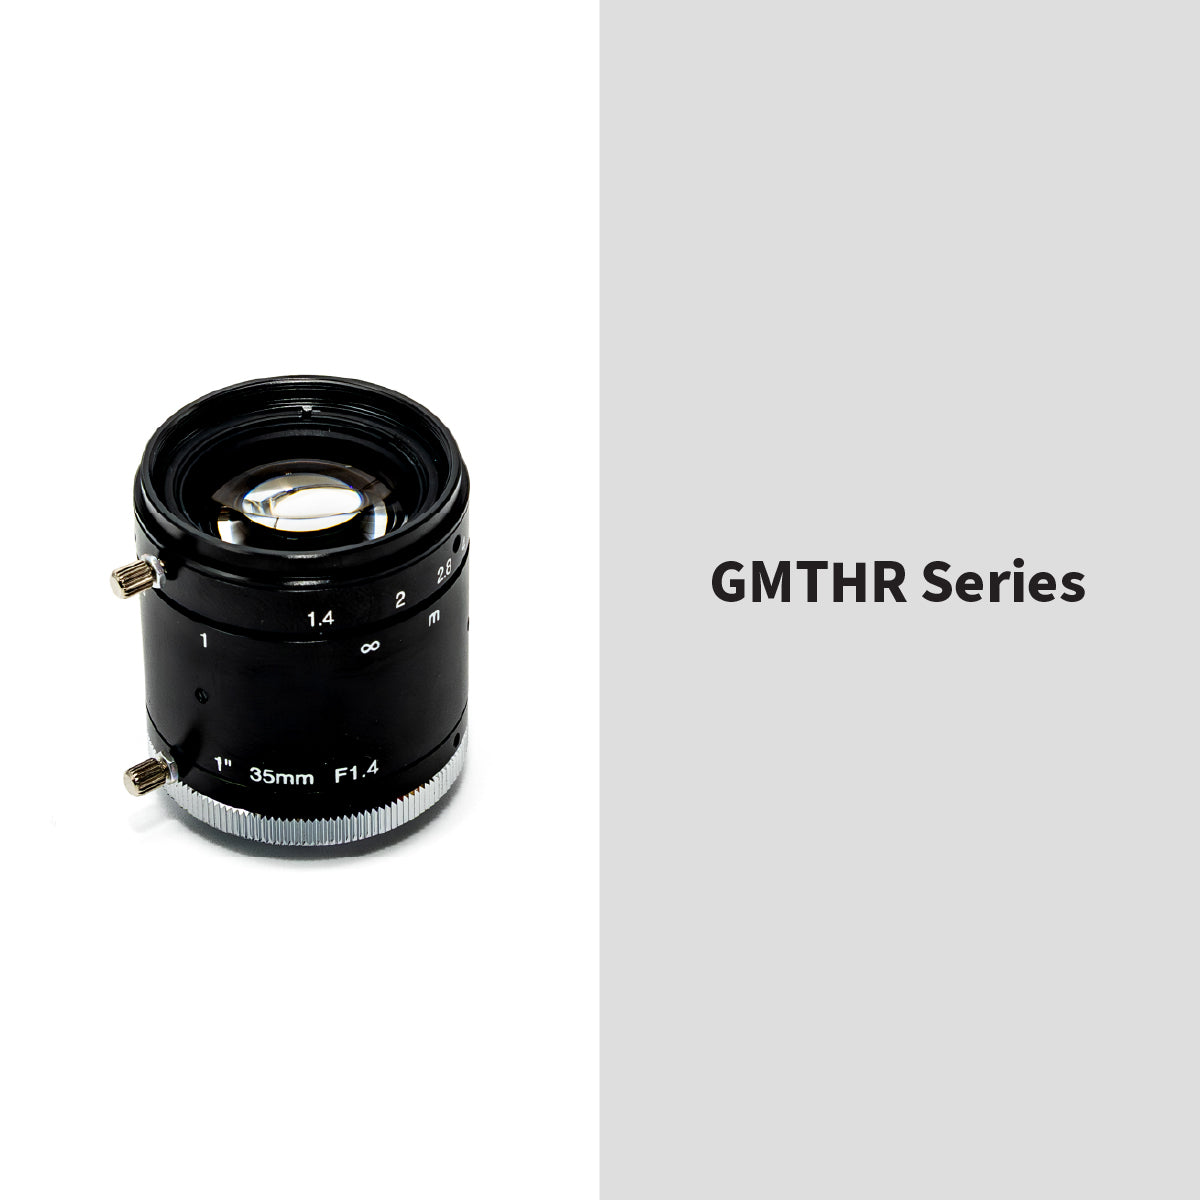


As agriculture and environmental monitoring become increasingly data-driven, NDVI (Normalized Difference Vegetation Index) has become one of the most widely used tools for assessing vegetation health.
What Is NDVI?
NDVI is a mathematical formula used to measure plant health by analyzing how vegetation reflects two key wavelengths of light:
- Red light: absorbed by chlorophyll for photosynthesis
- NIR (Near-infrared) light: strongly reflected by healthy plant cell structure
The formula is:
NDVI = (NIR – Red) / (NIR + Red)
Values range from –1 to +1, where:
- +1 → dense, healthy vegetation
- 0 → sparse or stressed vegetation
- –1 → non-vegetation surfaces (water, soil, buildings)
How NDVI Imaging Works
NDVI imaging analyzes the difference between how plants absorb red light and reflect NIR light. Healthy plants absorb most red wavelengths and reflect large amounts of NIR, while stressed or diseased plants reflect less NIR and more red.
To capture NDVI, you need:
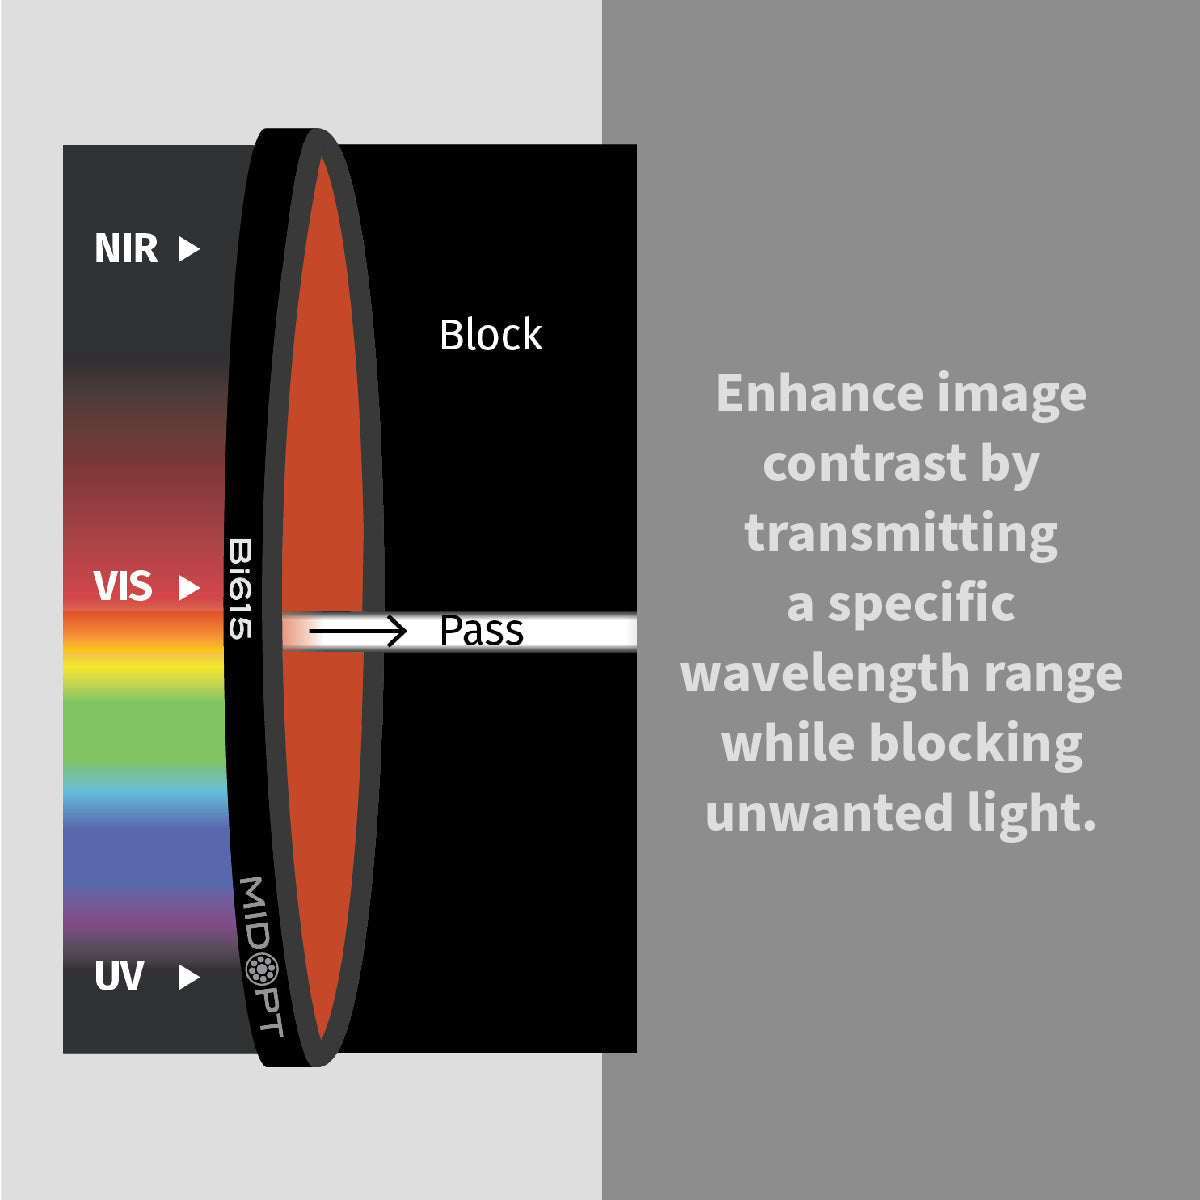
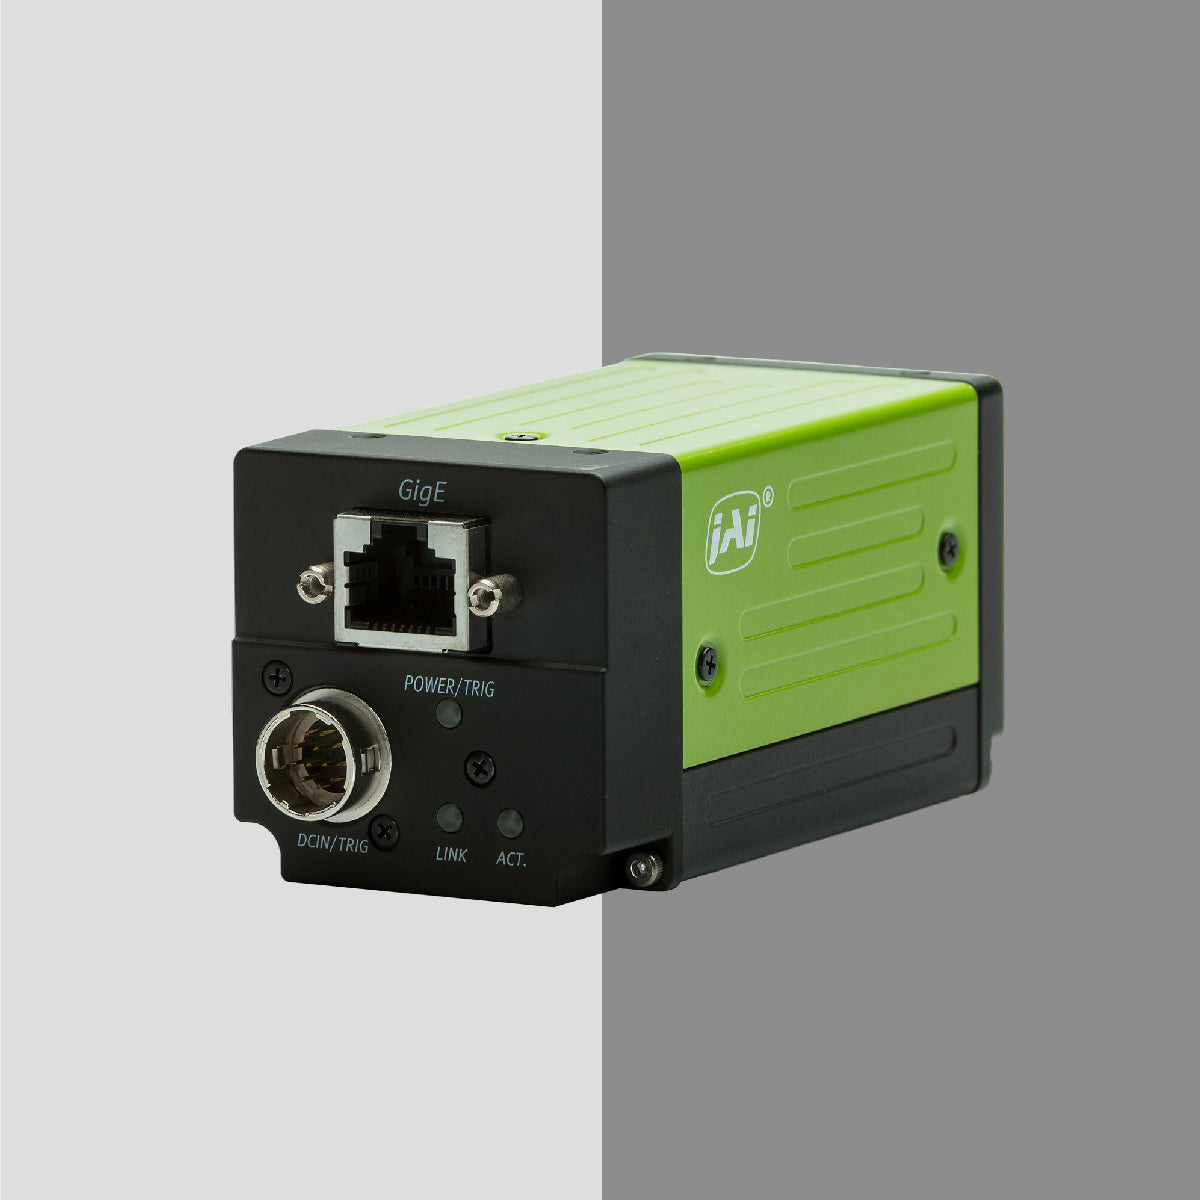
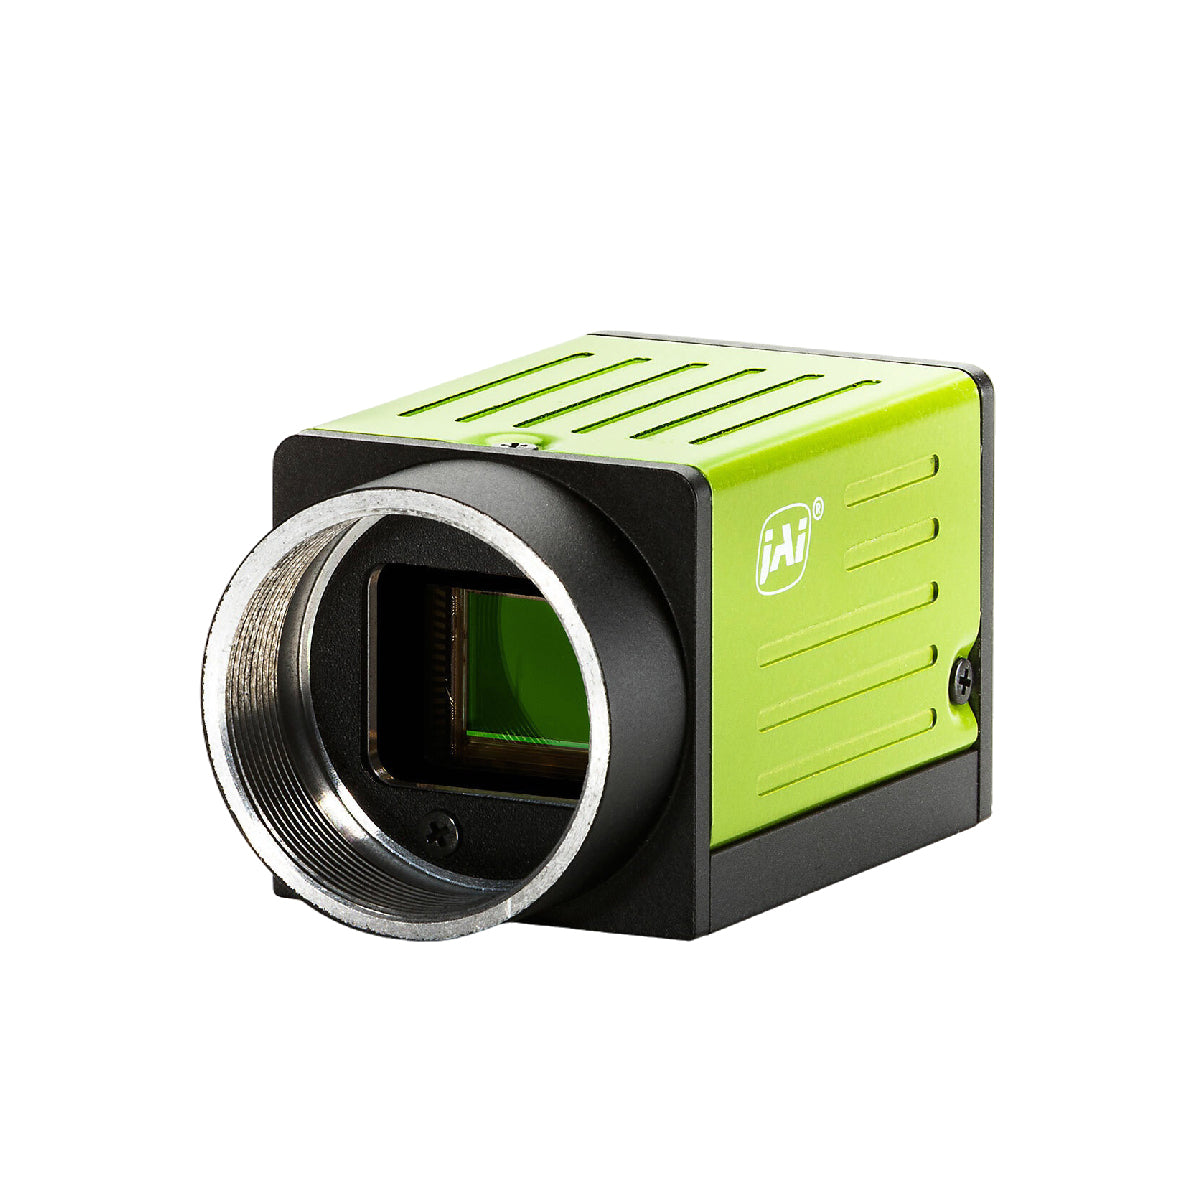
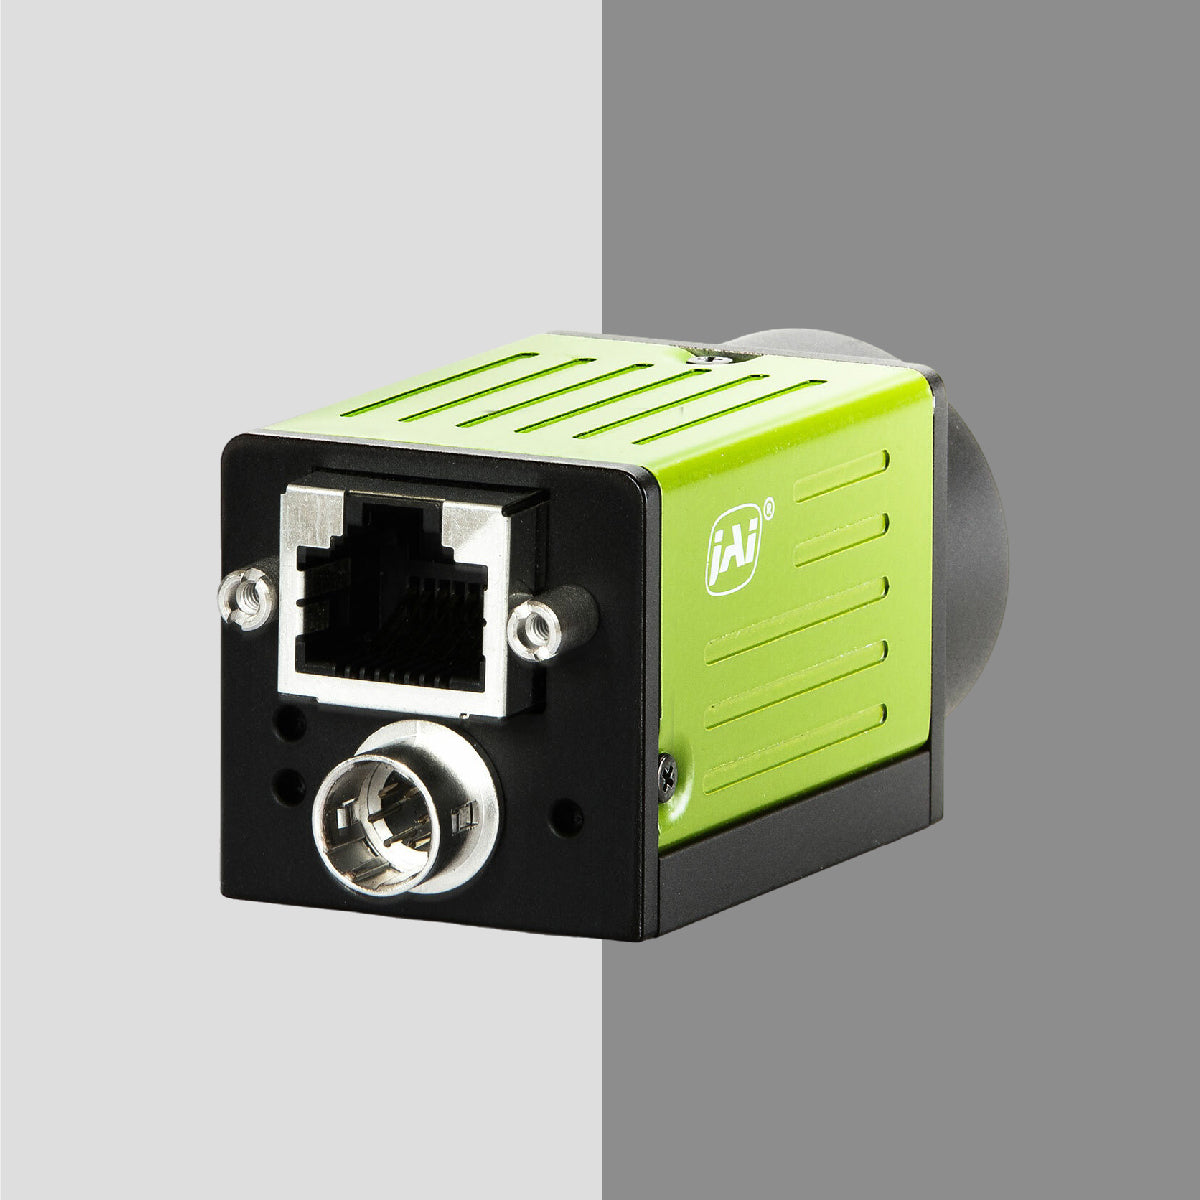
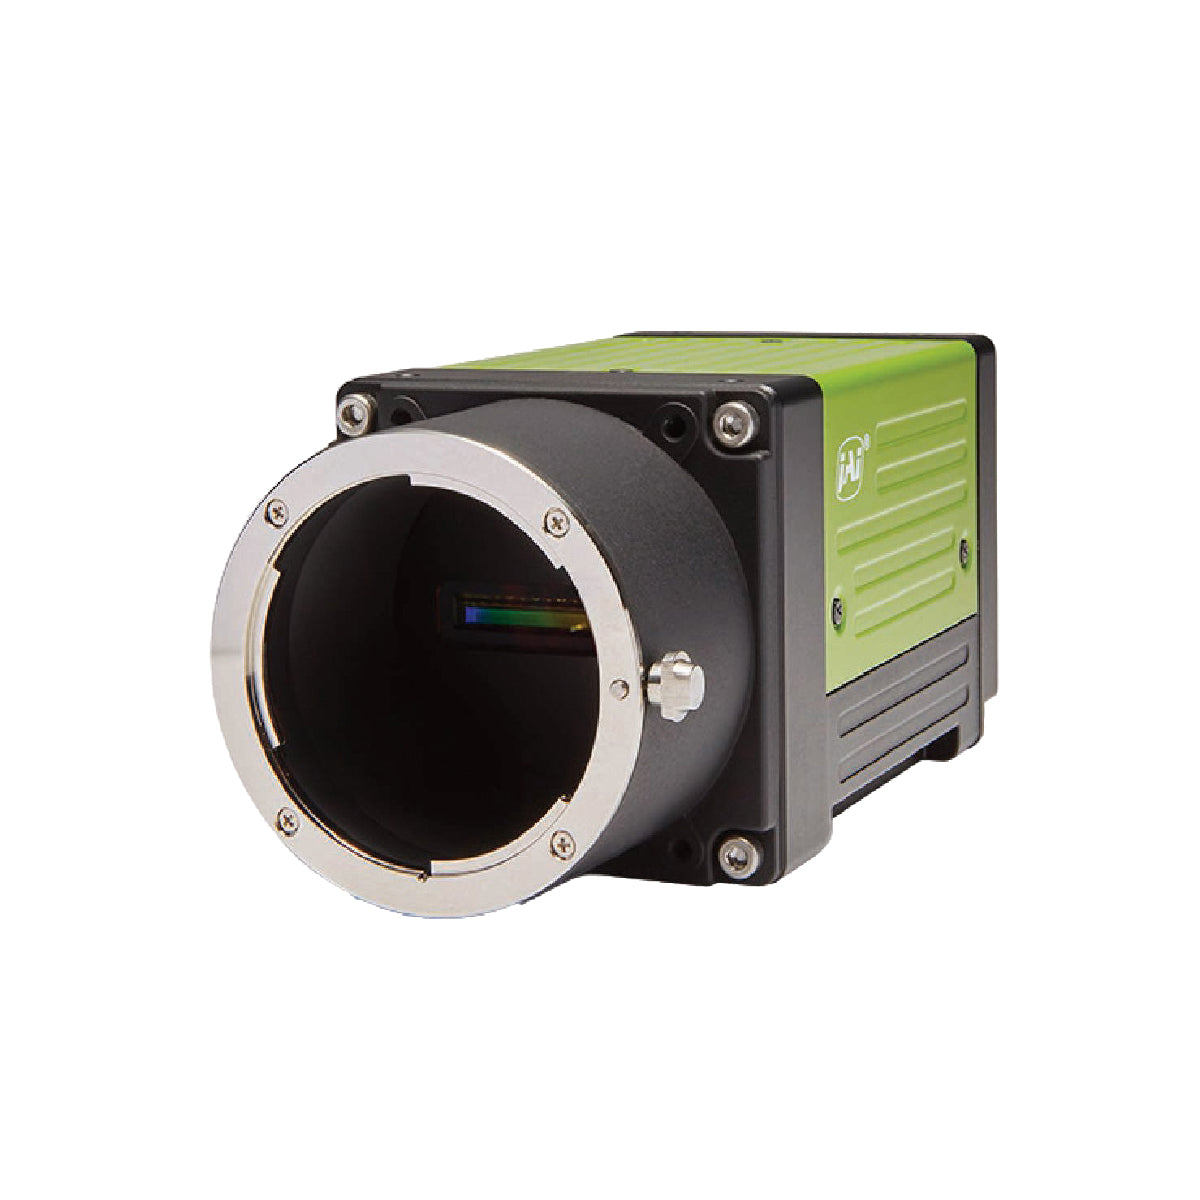
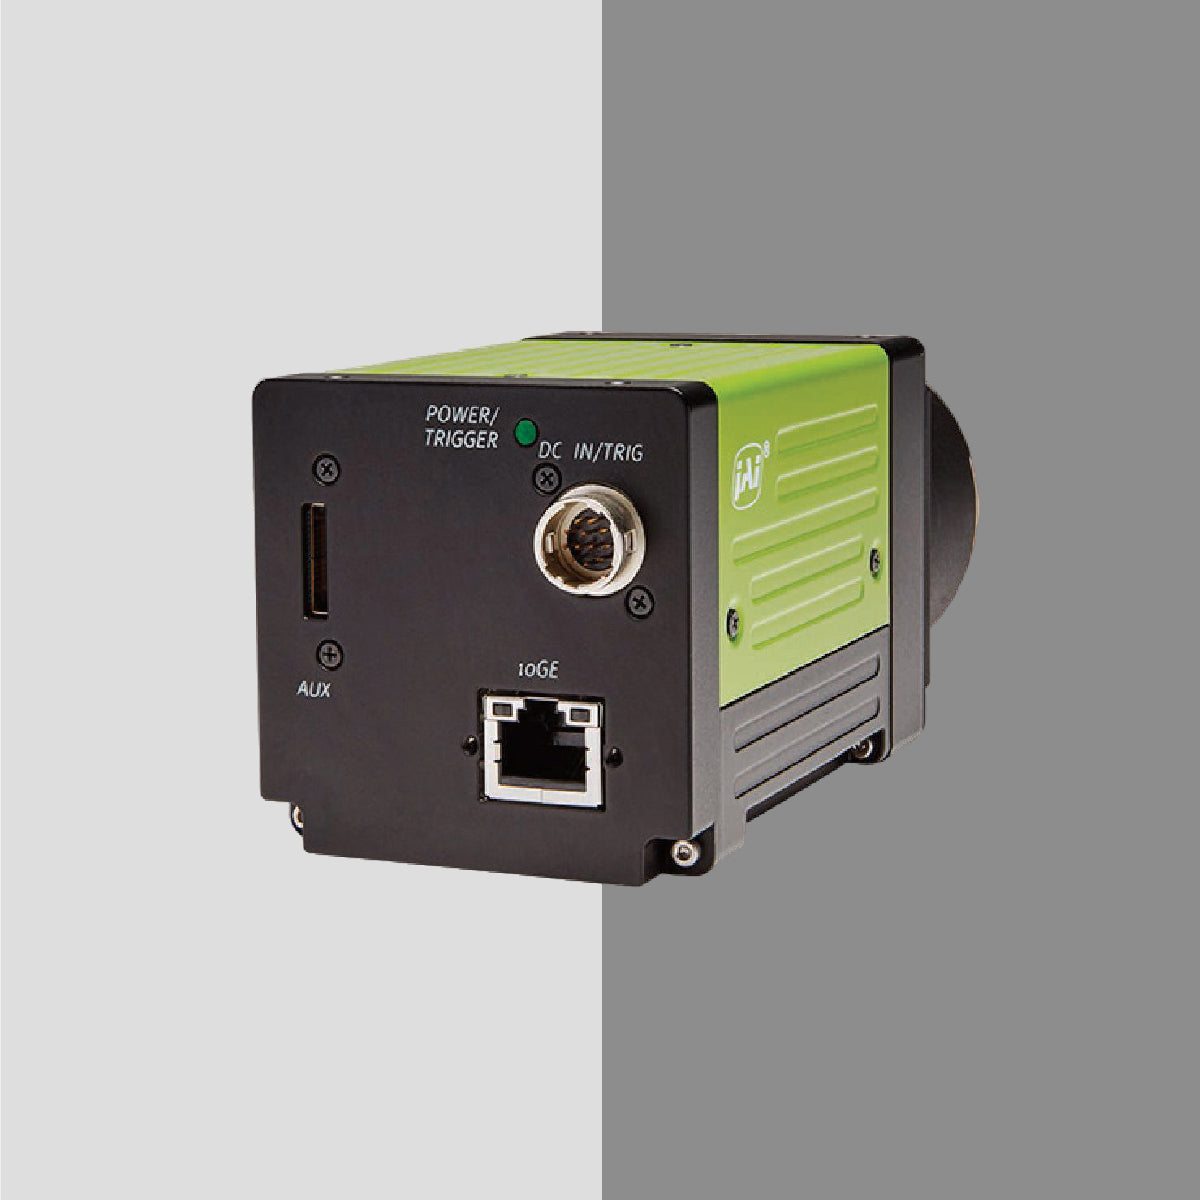
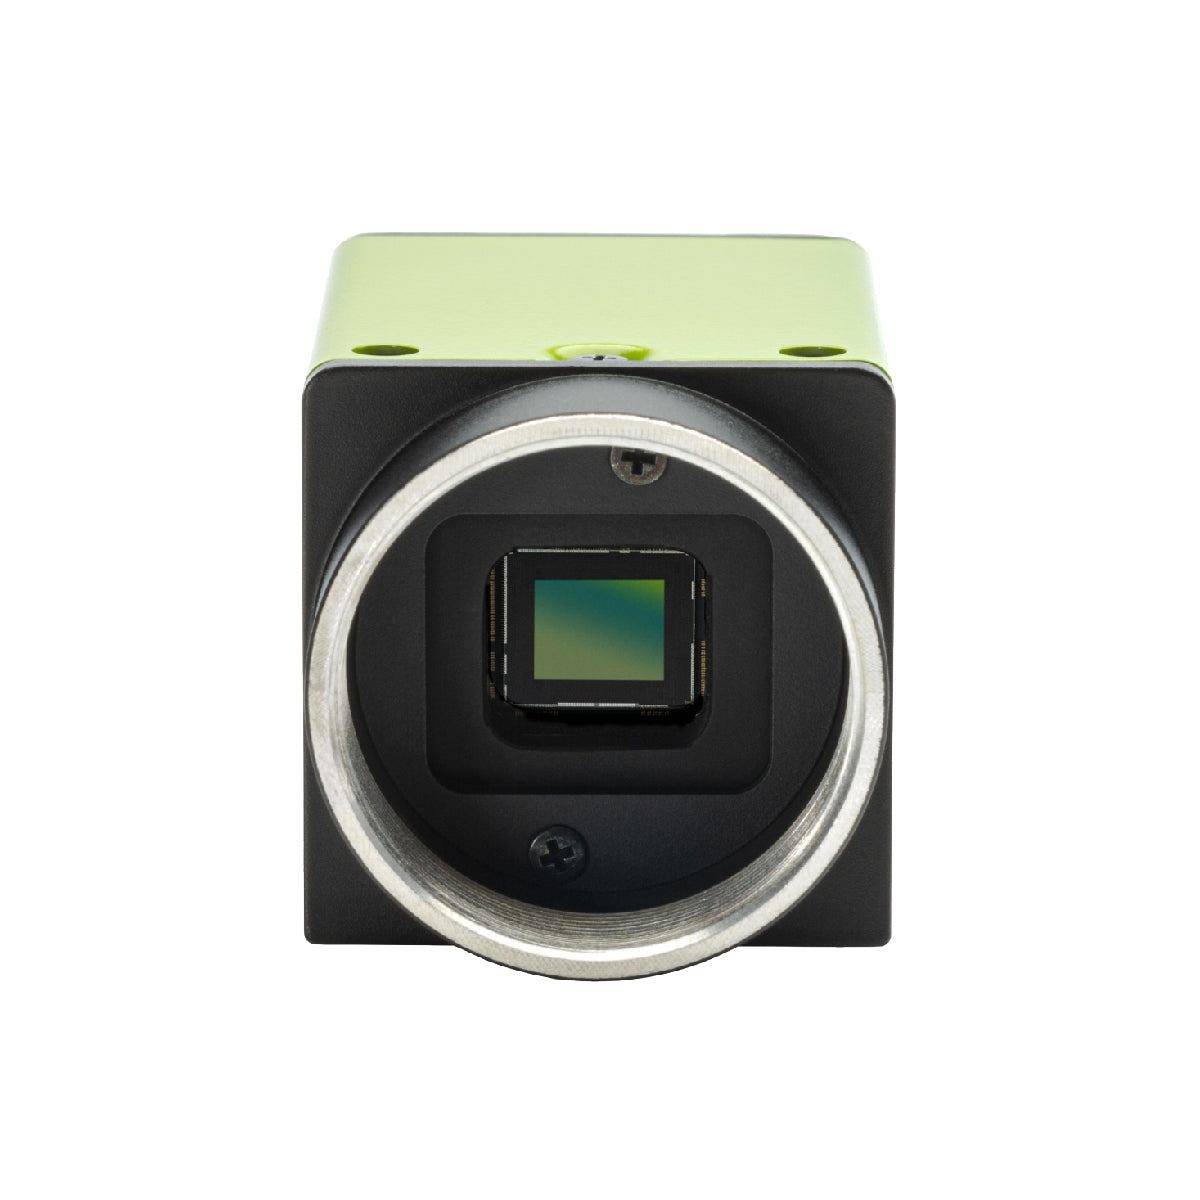
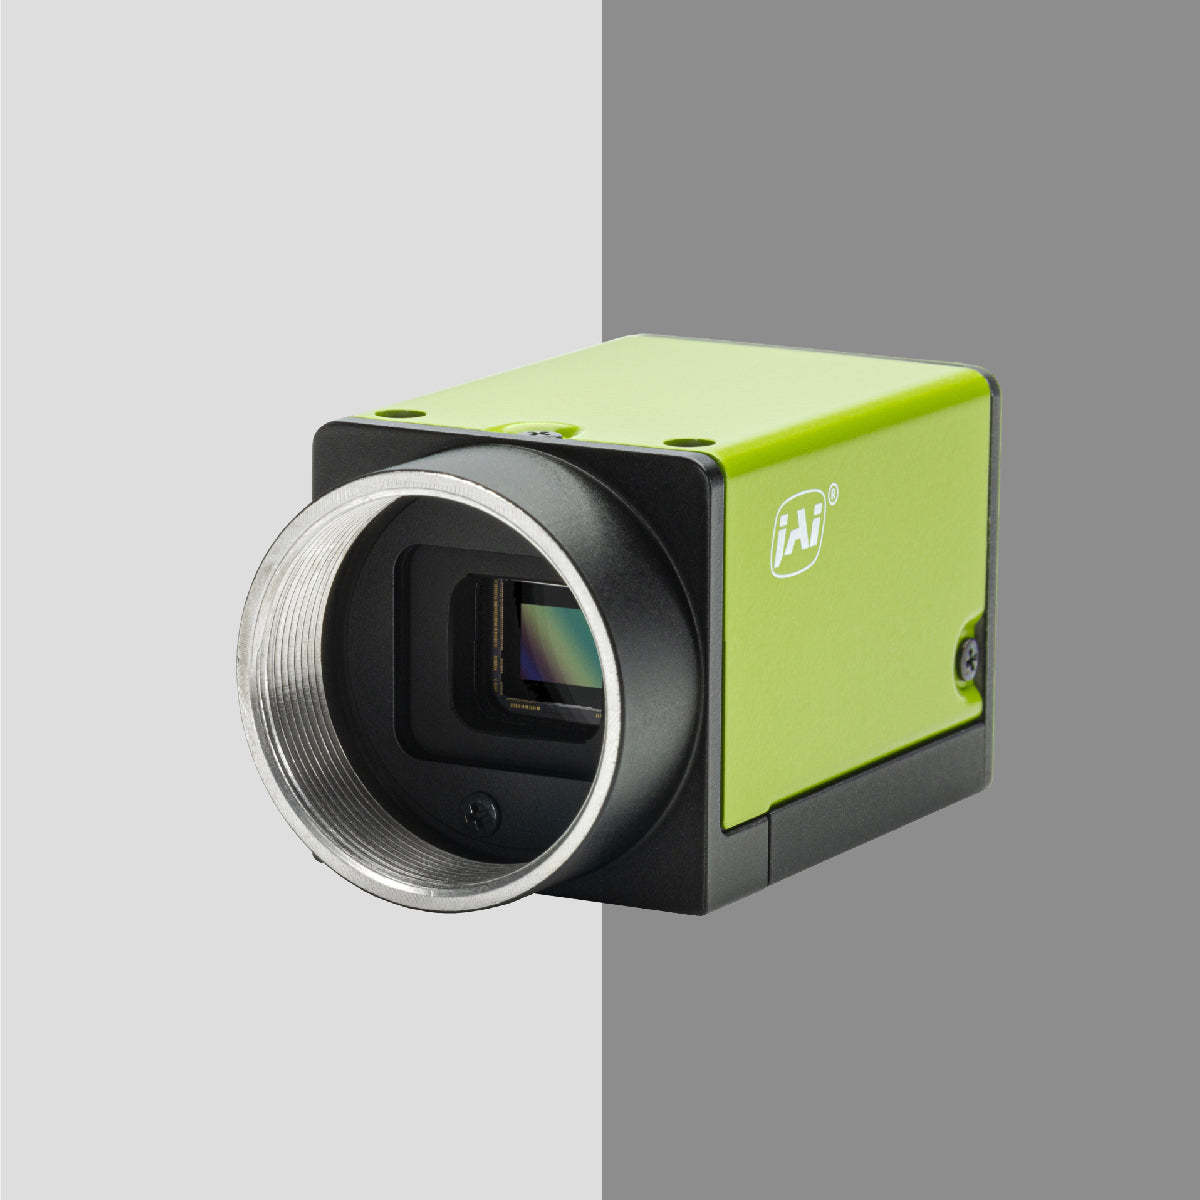
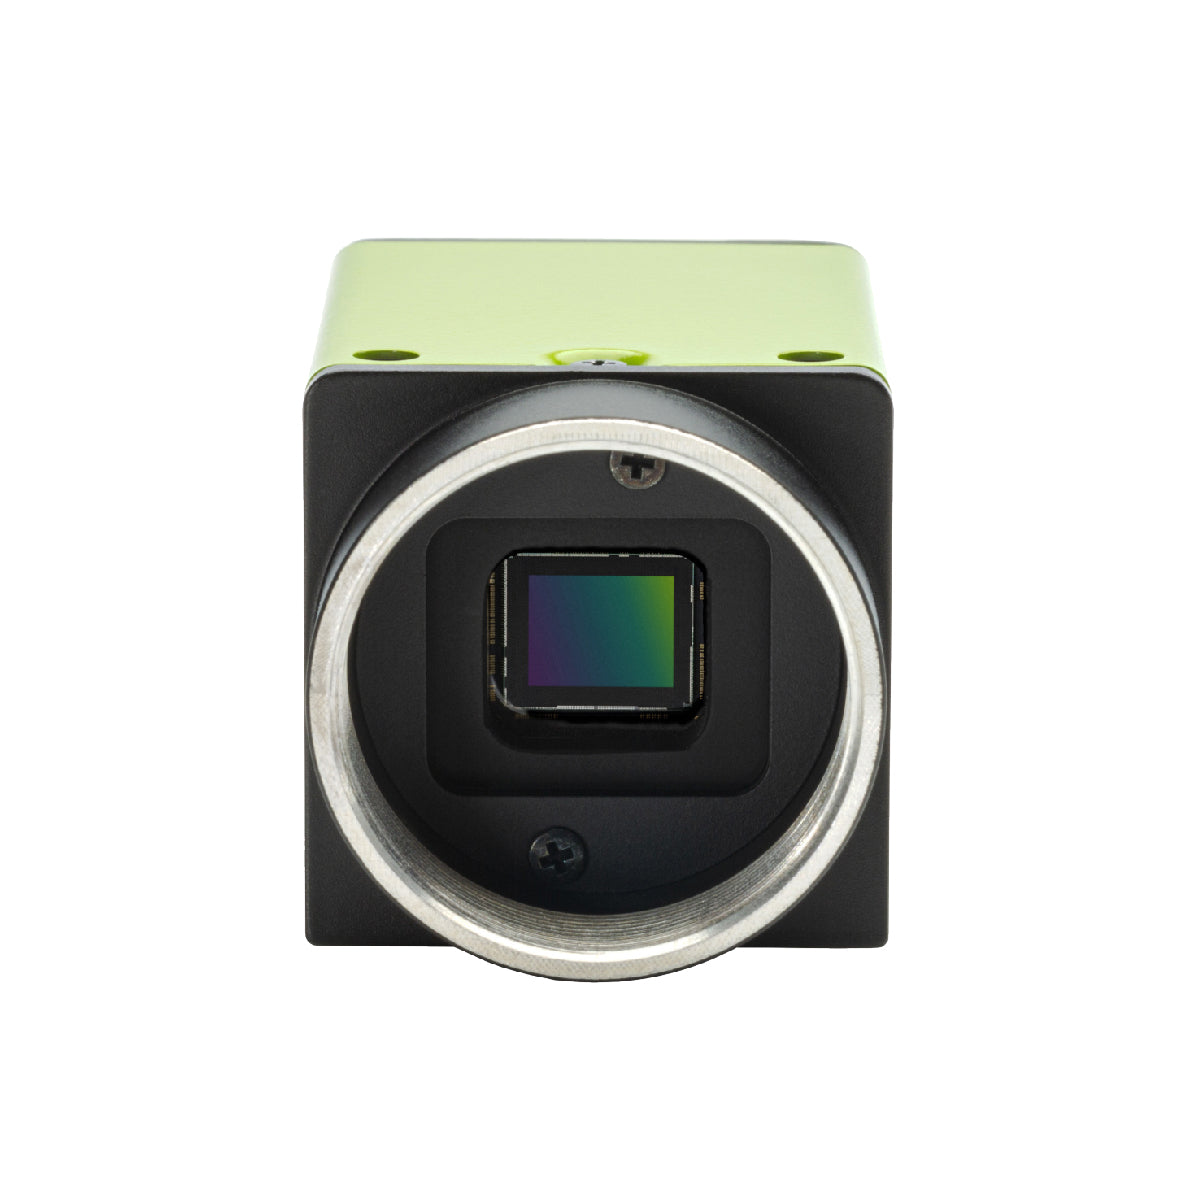
- A camera that can detect NIR and red wavelengths
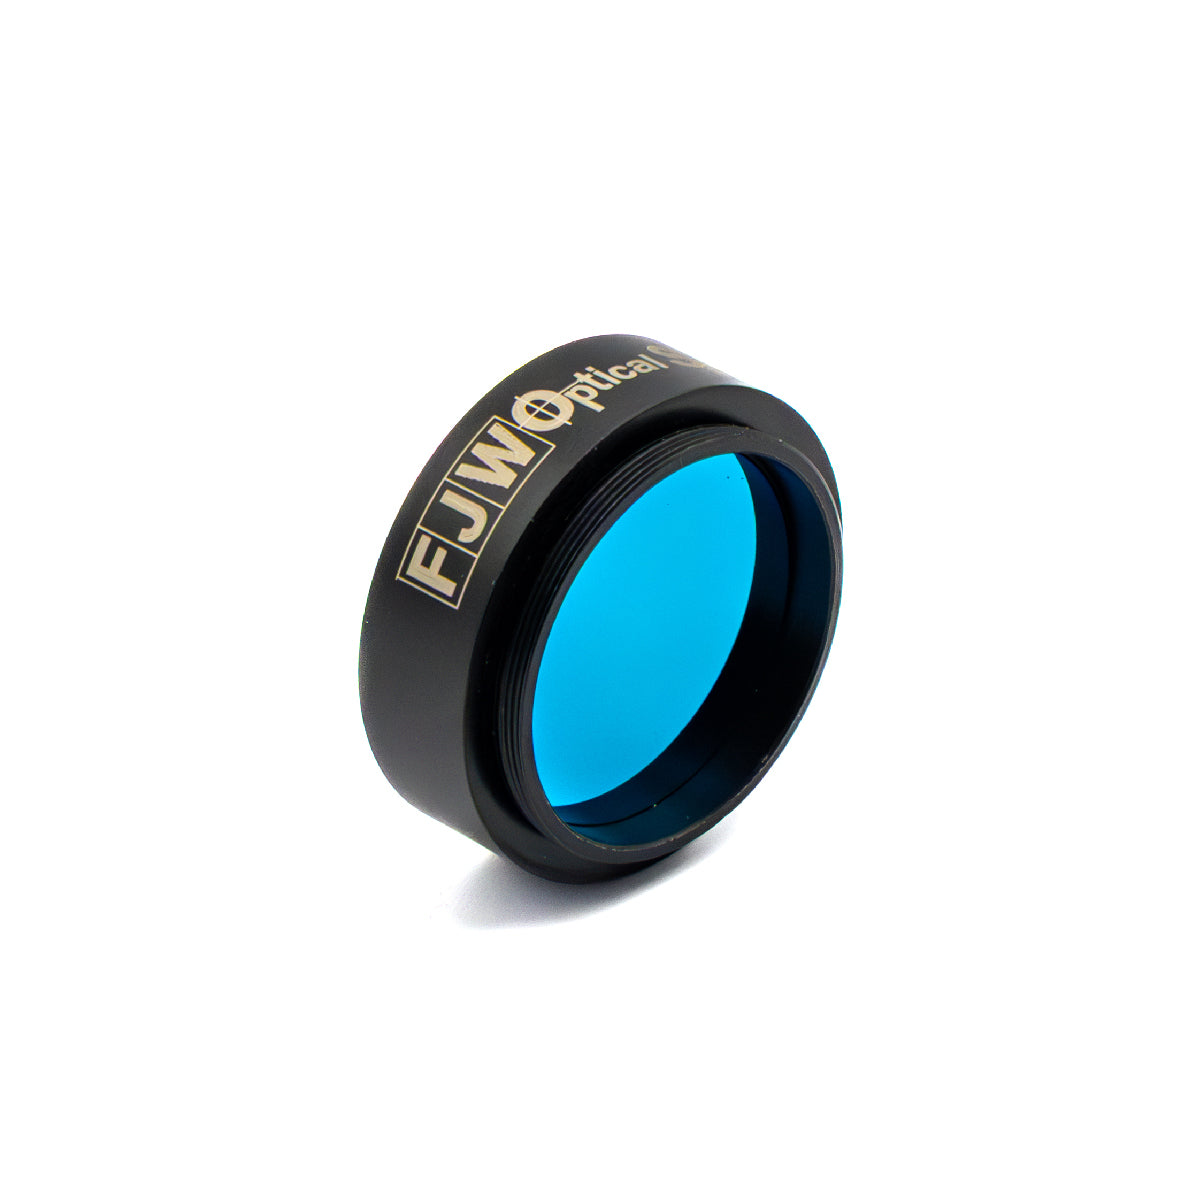
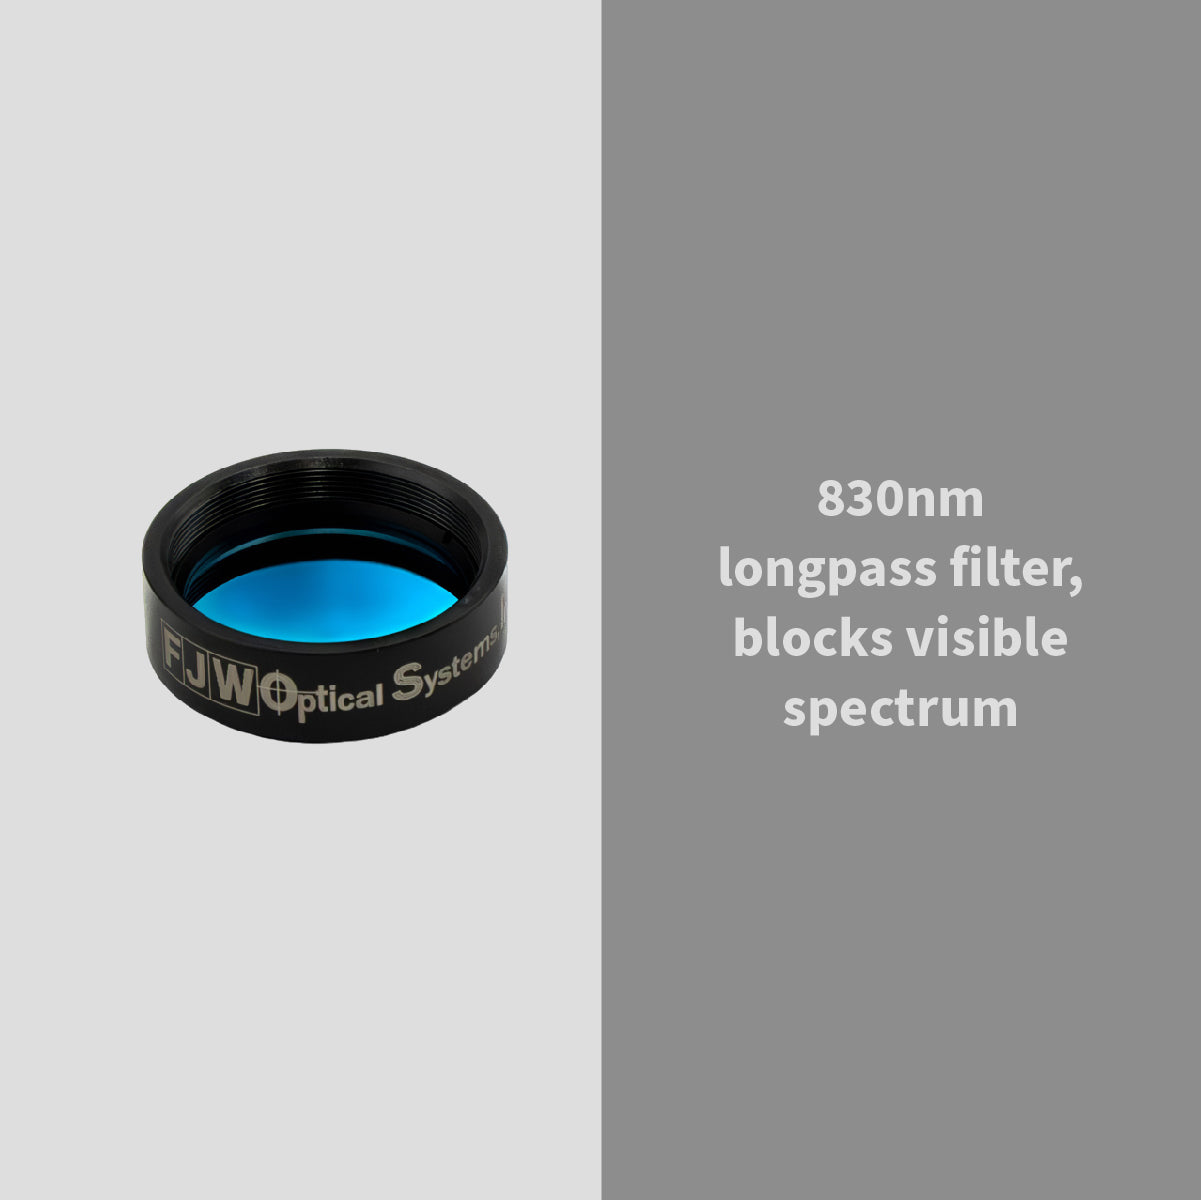
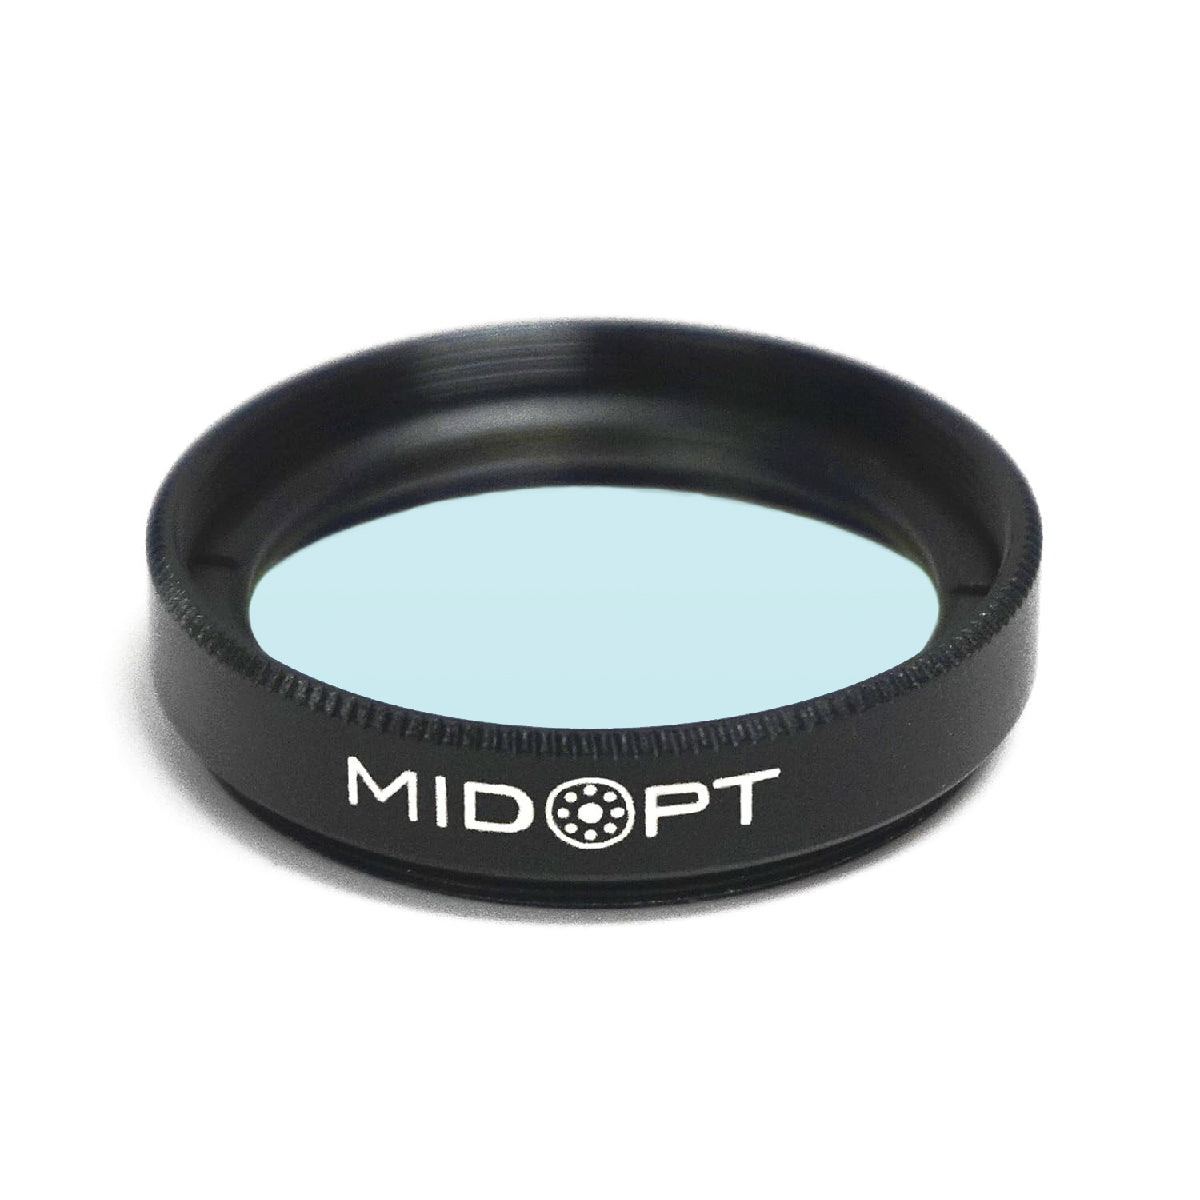
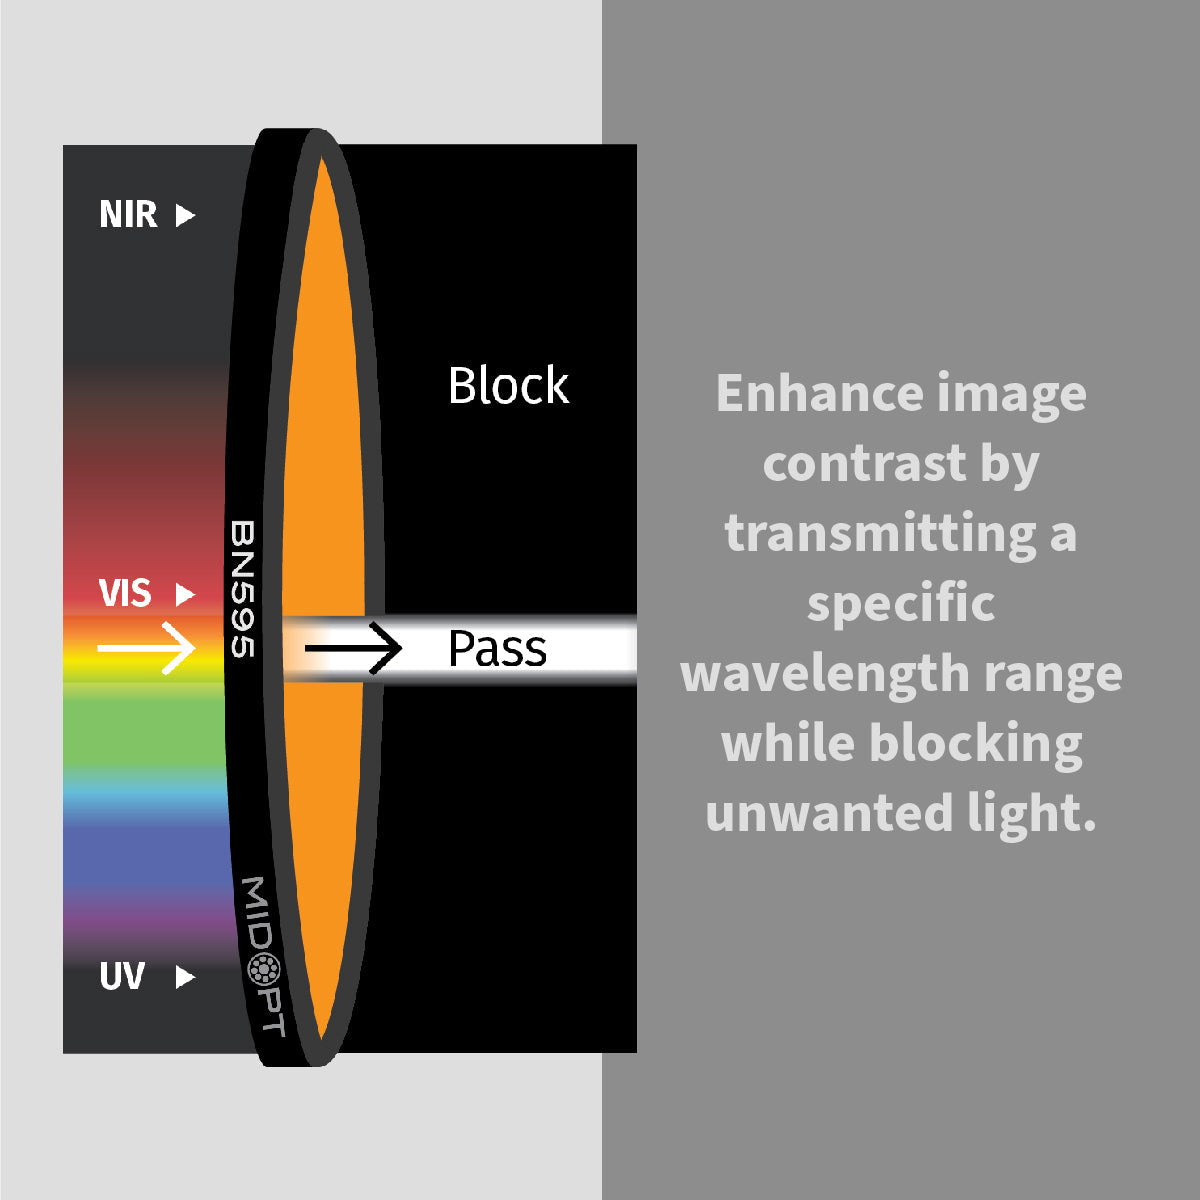
- A dual-band filter or multispectral sensor
- Software to calculate NDVI and create visual maps
This setup can be integrated into:
- Drones
- Ground-based machine vision systems
- Satellites
- Handheld field sensors
What NDVI Imaging Reveals
NDVI imaging provides insights into vegetation health that cannot be seen with the naked eye, such as:
✔ Chlorophyll density: High chlorophyll = vigorous growth.
✔ Water stress: Plants under drought reflect less NIR.
✔ Early disease detection: NDVI picks up stress before color changes appear.
✔ Plant biomass and canopy coverage: Healthy crops create strong NIR signals.
✔ Growth uniformity across a field: Variations help target fertilizer, irrigation or scouting.
Machine vision systems use NDVI to generate false-color maps, where vegetation health differences appear as bright greens, yellows or reds.
When to Use NDVI Imaging
NDVI imaging is ideal when you need fast, accurate, large-area assessment of plant conditions.
Best Use Cases
Crop health monitoring: Farmers use NDVI to identify nutrient deficiencies, water stress, and disease early.
Precision agriculture: NDVI helps guide: variable-rate fertilizer, targeted irrigation and zone-based spraying
Satellite crop monitoring: Satellites provide wide-area NDVI maps for: regional yield forecasting, drought analysis and environmental monitoring
Drone-based field analysis: Drones equipped with NDVI filters offer: high-resolution mapping, real-time crop insights and frequent field monitoring at low cost
Forestry & land management: NDVI identifies vegetation density, deforestation, burn scars and regrowth.
Machine vision systems: Industrial and research setups use NDVI to: analyze plant traits, automate greenhouse monitoring and support phenotyping studies
Why NDVI Remains So Popular
Despite newer multispectral indices, NDVI remains the global standard because it is:
- Simple to calculate
- Highly reliable and widely validated
- Compatible with drones, satellites and machine vision
- Effective for early stress detection
- Easy to visualize and interpret
NDVI has become a cornerstone of modern crop monitoring, from small farms to large-scale agricultural operations.
By analyzing how plants reflect NIR and red light, NDVI provides a fast and powerful way to assess vegetation health across entire fields or regions. Whether captured from satellites, drones, or ground-based cameras, NDVI remains one of the most accessible and impactful tools for plant monitoring today.